Top 10 of Everything 2015
By: Paul Terry
-
Rs 590.75
- Rs 695.00
- 15%
You save Rs 104.25.
Due to constant currency fluctuation, prices are subject to change with or without notice.
| Book | |
| What's in the Box? | 1 x Top 10 of Everything 2015 |
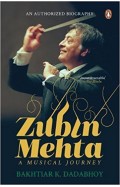
Zubin Mehta: A Musical Journey (An Authorized Biography)
By: VOID - Bakhtiar K. Dadabhoy
Rs 892.50 Rs 1,050.00 Ex Tax :Rs 892.50
Percy Jackson and the Titan's Curse (Book 3)
By: Rick Riordan
Rs 1,525.75 Rs 1,795.00 Ex Tax :Rs 1,525.75
The Origins of Political Order From Prehuman Times to the French RevolutioN
By: Francis Fukuyama
Rs 4,045.50 Rs 4,495.00 Ex Tax :Rs 4,045.50
Percy Jackson and the Titan's Curse (Book 3)
By: Rick Riordan
Rs 1,525.75 Rs 1,795.00 Ex Tax :Rs 1,525.75
Five Families - The Rise, Decline, and Resurgence of America's Most Powerful Mafia Empires
By: Selwyn Raab
Rs 7,375.50 Rs 8,195.00 Ex Tax :Rs 7,375.50
The Complete Sherlock Holmes Collection
By: Sir Arthur Conan Doyle
Rs 7,375.50 Rs 8,195.00 Ex Tax :Rs 7,375.50
Wild Kitchen - Nature-Loving Chefs at Home
By: Claire Bingham
Rs 6,965.75 Rs 8,195.00 Ex Tax :Rs 6,965.75
Zubin Mehta: A Musical Journey (An Authorized Biography)
By: VOID - Bakhtiar K. Dadabhoy
Rs 892.50 Rs 1,050.00 Ex Tax :Rs 892.50
Percy Jackson and the Titan's Curse (Book 3)
By: Rick Riordan
Rs 1,525.75 Rs 1,795.00 Ex Tax :Rs 1,525.75















-120x187.jpg?q6)







-120x187.jpg?q6)

-120x187.jpg?q6)
